 Docs
DocsBottleneck
Overview
Bottleneck analysis identifies what impact the individual process steps have on process performance. This way you can detect process weaknesses and choose the best improvement candidates.
While using the Bottleneck analysis, you focus on the longest, most time-consuming, or costly process steps. This allows searching for solutions that will keep the issue from happening again in the future. Bottlenecks are often caused by unnecessary or inefficient processes, which result in additional time and cost spends. Being aware of the extra losses is the first step to eliminate them. Once you fix the bottleneck, the process will be performed from start to finish at an even rate.
Dealing with Bottleneck analysis
The impact of events on the process is determined by the time interval or event cost. The program generates metrics for the chosen analysis option. You can sort metrics to find out process steps that should be reviewed or improved. To use this analysis module, select Bottleneck analysis in the drop-down list under the project's name. Set up the analysis to discover bottlenecks in the process or open the existing bottleneck configuration and select the desired data set to explore.
Proceeding with results
Completing the Bottleneck analysis can be the first step of investigating processes. The information gathered from the analysis module helps to focus on the notable steps that slow down and increase the cost of the whole process.
After identifying which events causes a bottleneck, the next step could be to go deeper in the analysis to discover the root causes. For example, proceed with the Breakdown analysis module to drill into timeline dimensional data. Discover the process from event attributes perspective, for example, who is in charge of certain steps, where they happened, and other attributes.
Workspace
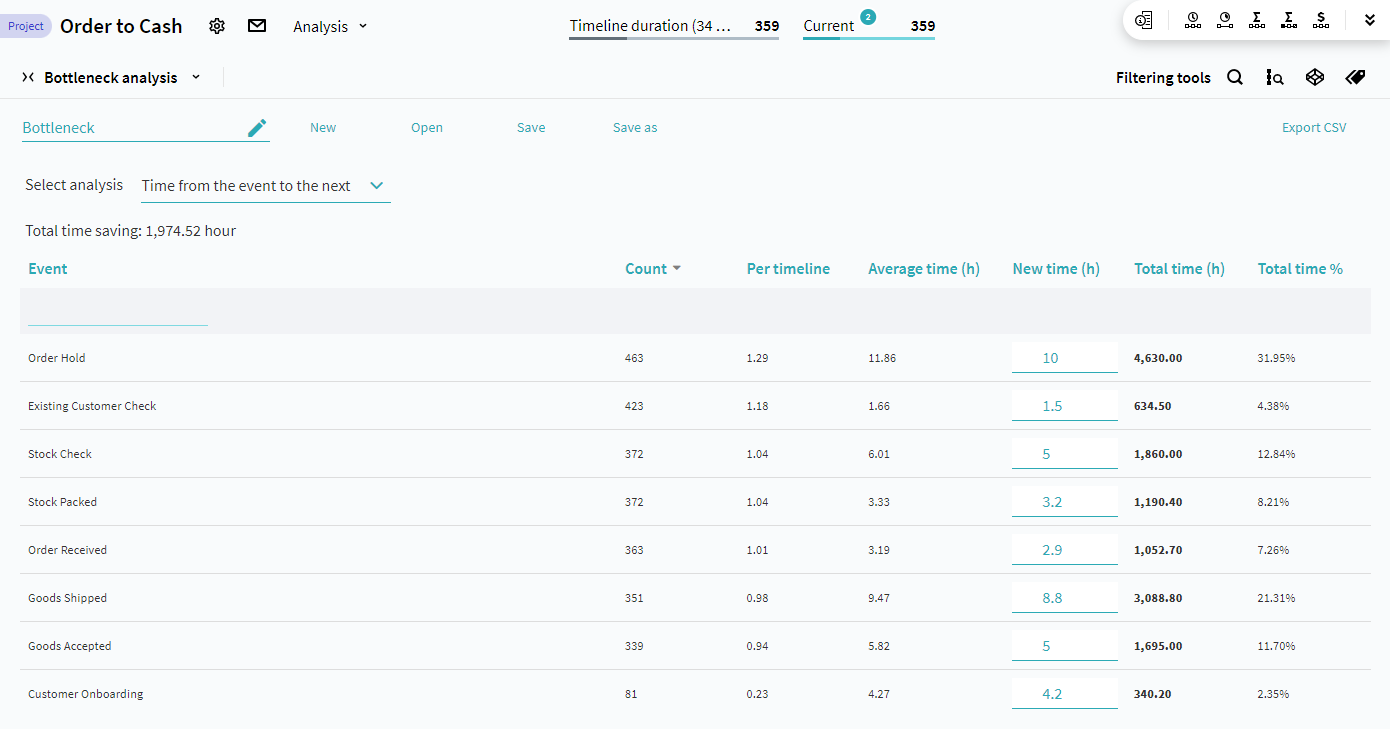
Bottleneck analysis has an intuitive workspace. It consists of a selected analysis option, a table where the process statistics is displayed, and total savings. At the top, there is the managing pane where you can name your bottleneck, create a new one, and save the analysis configuration. Click Open to see the list of existing bottleneck configurations.
When you work with the Bottleneck analysis, the process statistic is shown for the currently applied filters. You can find them at the top of the program in the Current section. It allows applying analysis configuration to the preselected timelines and sets. For more details, see Filters.
In addition, the Calendar settings affect the statistic calculated while working with Bottleneck analysis. For more details, see Calendars.
Configuration
The application performs Bottleneck analysis based on one of analysis options. These options refer to time or cost conditions.
Configure Bottleneck using time conditions
- Enter the name of a bottleneck configuration.
- Select the analysis option for the calculated statistics. Choose one of the following options from the Select analysis drop-down list:
Time from the event to the next
Amount of time spent between this event and the next subsequent event in the timeline. By default, this option is selected.
Time from the event to the previous
Amount of time elapsed between this event and the previous event in the timeline.
Time defined by second timestamp
Amount of time spent between this event and the auxiliary timestamp for this event. The program takes auxiliary timestamp from a column mapped during the data upload. Select the column name with the auxiliary timestamp in the Second timestamp drop-down list, that appears after choosing the Time defined by second timestamp option.
To use this option, the uploaded data must include mapped columns with additional timestamps. For details on the mapping optional fields during manual data upload, see How to define and use optional fields.
Time between events
Amount of time spent between two certain events. These events differ and follow each other in timelines.
-
After you select one of the options in the previous step, you will see the process statistics. It is represented by the following values in the table:
Table column Description Count Number of times an event occurs across selected timelines.
As a timeline can contain the same event more than once, the number of events could be more than the number of timelines.
Per timeline Number of times an event occurs on average per timeline. Average time (h) Average time between this event and subsequent or previous event. New time (h) An input field where the custom Average time value can be specified to estimate total time saving.
Total time (h)
Total time spent between this event and subsequent or previous event.
Total time %
Percentage of total processing time spent between this event and subsequent or previous event.
-
Enter the custom average time in the New time field to see how it will influence the process. After that, the Total time columns will show updated values based on the entered data. Also, you will see the total amount of saved time in the top left corner.
-
Optionally, click Export CSV to save statistics for the currently selected timelines on your computer.
-
Click Save to keep bottleneck configuration in Process Intelligence.
It saves analysis settings: selected option and new time values.
If you open a saved bottleneck configuration, it applies settings to the filtered timelines defined by the Current section at the top.
Configure Bottleneck using cost conditions
- Enter the name of a bottleneck configuration.
- From the Select analysis drop-down list, select Cost of event. This option calculates amount of money spent on an event. To use this option, you need to specify event cost in Cost configuration.
-
After you select the cost condition, you will see the process statistics. It is represented by the following values in the table:
Table column Description Count Number of times an event occurs across selected timelines.
As a timeline can contain the same event more than once, the number of events could be more than the number of timelines.
Per timeline Number of times an event occurs on average per timeline. Average cost Average cost of a certain event based on cost configuration. New cost An input field where the custom average cost value can be specified to estimate total money saving.
Total cost
The amount of money spent on a certain event.
Total time %
Percentage of overall expense spent on a certain event.
-
Enter the custom average cost in the New cost field to see how it will influence the process cost. After that, the Total cost columns will show updated values based on the entered data. Also, you will see the total amount of saved time in the top left corner.
-
Optionally, click Export CSV to save statistics for the currently selected timelines on your computer.
-
Click Save to keep bottleneck configuration in Process Intelligence.
It saves analysis settings: selected option and new time values.
If you open a saved bottleneck configuration, it applies settings to the filtered timelines defined by the Current section at the top.
