 Docs
DocsProcess view
Overview
The analysis of business processes is a complex and challenging task, and is one in which clear visualization of the processes is particularly beneficial. The Process view feature introduced in Blue Prism Process Intelligence 2.0 is a powerful visualization tool which combines a schema view and a highly interactive board, and allows for flexible custom analysis. The Process View includes two interactive schema views:
- Primary path view – A type of schema that displays the most frequent and common flow of events in timelines, and allows you to find deviations from the common flow and the possible reasons for such deviations.
- Milestone view– A standard process schema, powered with the tools of the analysis module.
In addition to using these views, you can customize and drill down to every detail in your project in a highly interactive board by making use of metrics, dimensions, and other custom elements to boost the effectiveness of the analysis.
There is constant interaction between the schema and the board. For more information, see Views and boards interaction.
Workspace
To help find and understand any deviations, the Process view offers a split view consisting of a schema on the left, and a metrics board on the right. You can adjust their sizes by dragging the line between them.
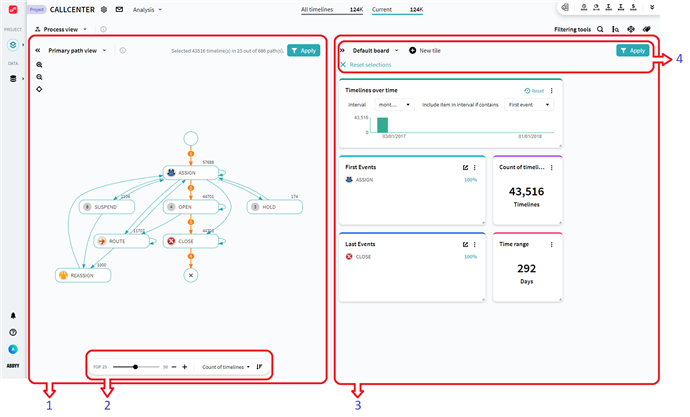
- The view side displays a process schema with statistics and controls by which you can filter the schema content. You can switch between two views: Primary path view and Milestone view, keeping the current board configuration.
- At the bottom of the section you can see the schema controls pane which allows you to change the content of the selected schema. For example, in the Primary path view you can move the slider to increase or decrease the number of displayed variations. Or you can select the display of the graph based on metrics such as number of timelines and their average duration.
- On the right side is a board of metric visualizations displayed on tiles. Tiles can represent events, the number of timelines in the current set, time range, or custom charts. You can use and edit the existing charts, create new ones, and configure the data table. The tiles help you understand the consequences of the deviations selected on the view side.
- At the top of the board are the board controls. You can switch between views, add new tiles, and apply them as filters to the current set in the project.
When using visual analysis, it is very important to have full control over the display of the components used. The Process view allows you to adapt the display by:
- Changing the sizes of the view and the board by moving the divider between them.
- Hiding one of the panes by clicking on the pane on which you want to focus.
- Dragging and dropping tiles to place them exactly where you need them, and dragging their corners to resize them.
