Docs
DocsDashboards
Main use
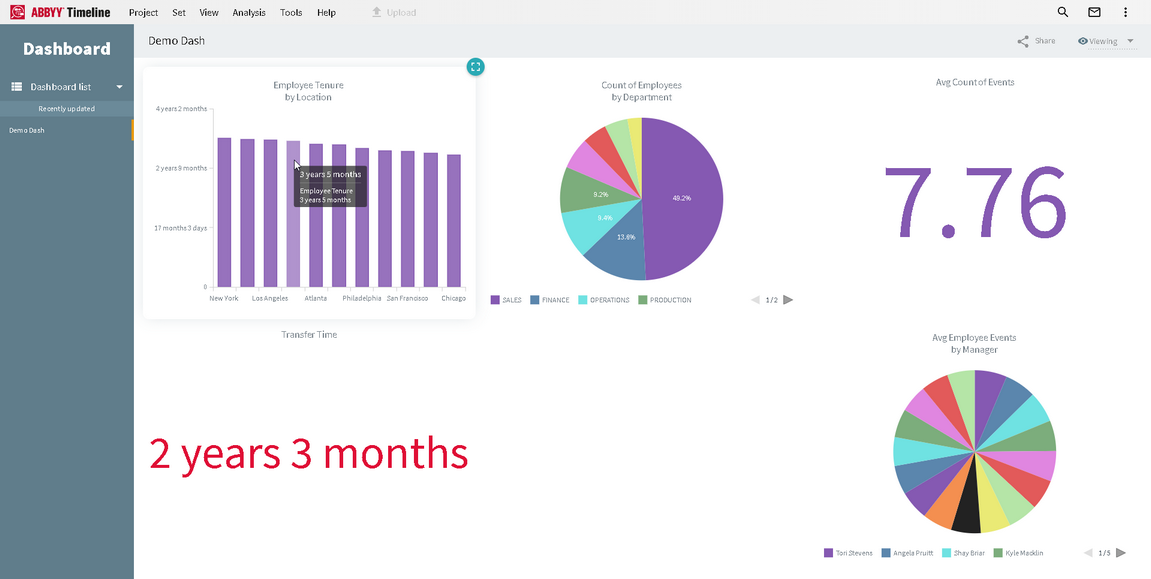
The dashboard feature provides at-a-glance views of KPIs (key performance indicators) relevant to a particular objective or business process (for example, sales, marketing, human resources, or production). Process Intelligence dashboards typically display custom metrics and can be used to drill in further on individual timelines.
To use this tool, select View > Dashboard > List of Dashboards.
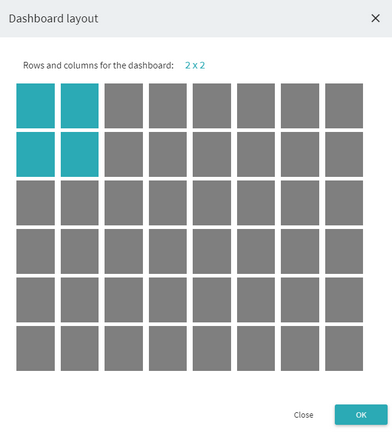
The dashboard is just about 100% customizable: the user can select the number of rows and columns of custom metrics.
The Process Intelligence dashboard displays the entire history of a process instance, allowing users to drill into problem areas and identify process inefficiencies and bottlenecks. These strategic dashboards support managers at numerous levels of an organization, and provide the quick overview that decision makers need to monitor the health and opportunities of the business.
Types of custom metrics
List of custom metrics
The metrics which could be calculated using the existing data.
This includes two types of metrics:
- Counts and time intervals between specific steps. The count could be of the timelines in a set or the number of specific protocol violations, also from the specific set. The interval metric specifies the pair of activities and calculates the time between them.
- The next type of custom metric is derived from supporting data files, which contain the information complimentary to the timelines. For example, a file could have columns: Activity, Attribute, and Cost so every record has the costs of the given activity with particular attribute value. Then the metrics could be defined as a cost of the whole timeline as a sum of all costs of its activities.
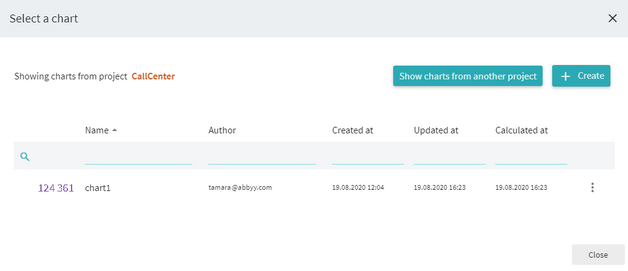
Example