Docs
DocsTime range
Main use
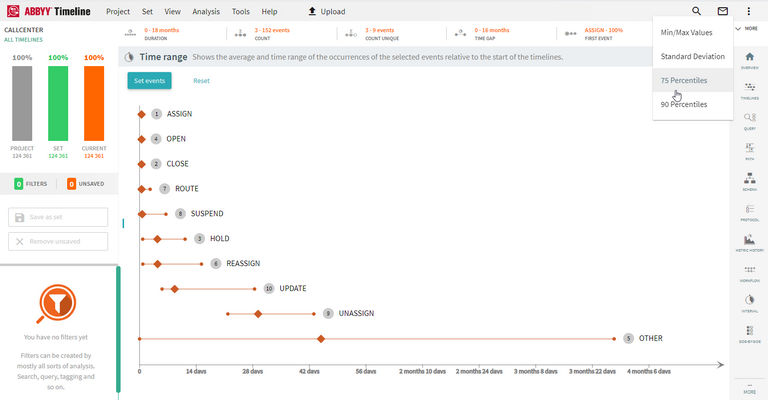
The Time Range chart shows the average and time range of the occurrences of the selected activities relative to the start of the timelines with the option to choose min/max, standard deviation, 75th percentiles, as well as 90th percentiles.
To use this tool, select the Analyze > Time range menu.
Overview
Configuration
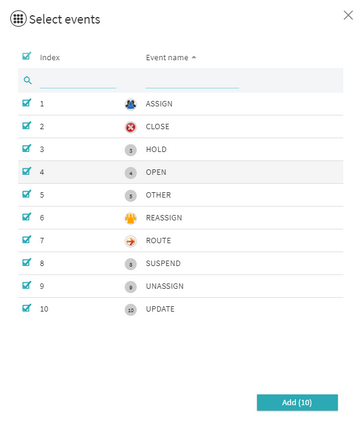
You can configure the chart by clicking the Set events button in the top left corner.
The modal configuration panel includes the list of activities/events. Then by selecting the events, you can begin to analyze time range for those specific events.
Not all events need to be selected and measured.
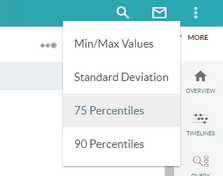
Time range options:
- Min/Max
- Standard deviation
- 75 percentiles
- 90 percentiles
These can be changed in the top right corner.
Example