 Docs
Docs
Project homepage
To open the project homepage, click View > Home.
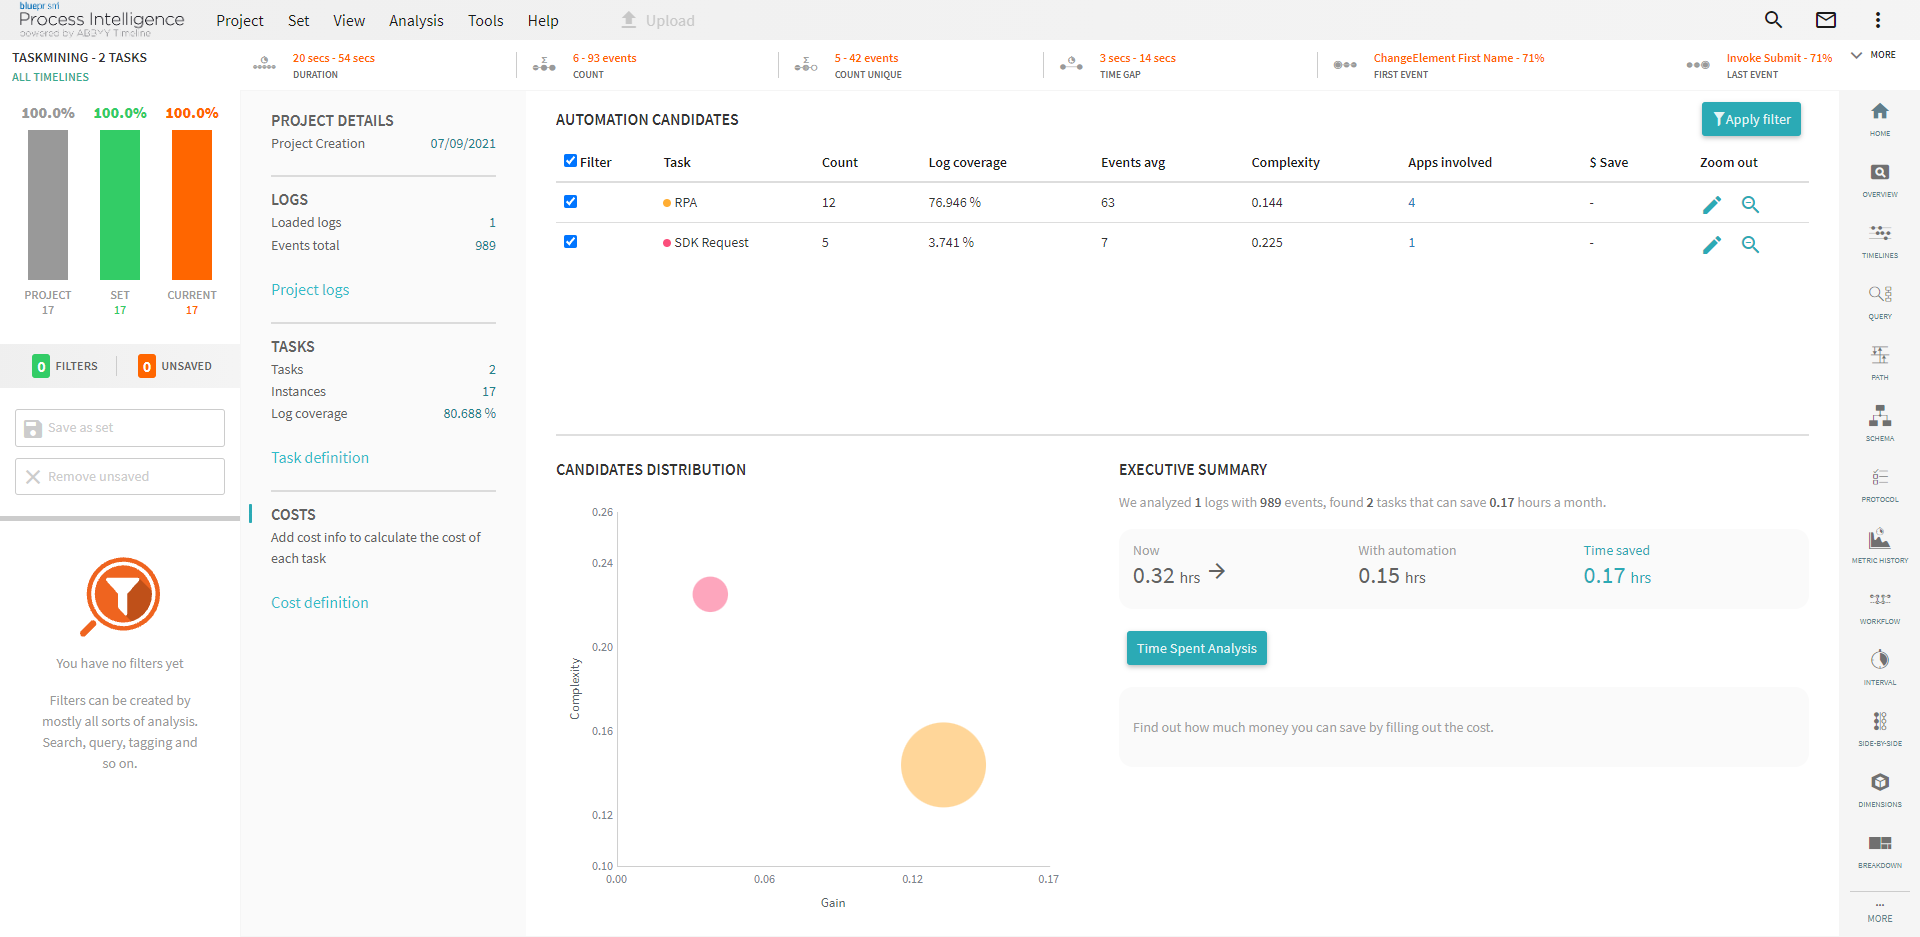
Once logs have been uploaded, the project homepage opens. Here you can:
- See uploaded logs in Project logs.
- Define tasks in the Task Definition Editor and review forms in the Form Editor.
You can define tasks for data analysis, so Process Intelligence treats each task instance as a timeline.
After identifying tasks, on the project homepage you will see:
- The Automation Candidates table with detailed information about each task.
- The Candidates Distribution chart.
- An Executive summary with the cost and time spent on the defined tasks:
Time Spent Analysis with statistics about the time a user works in different applications. Click the name of an application in the Classification column to display the number of tasks and timelines per domain.
Money saved based on defined costs. If you set costs for your tasks, the amount of money that can be saved after automation is displayed. Use the Cost definition option to specify costs for your tasks.
Cost definition
You can estimate how much money your company will save from task automation. For example, if you know the hourly rate of an employee who performs a certain task, you can set this rate in Cost definition to see the saved costs displayed in the Automation Candidates table.
To specify the cost of a task:
- Click Cost definition on the project
- In the Cost definition dialog, enter:
- The hourly rate or fixed cost for the task. If both values are specified, only the fixed cost will be used in calculations.
- The currency to be used. This currency will also be used in the Cost configuration dialog box of your Task mining project.
-
Click Save.
The application will calculate the amount you can save and display the result in the Executive summary section.
You can specify the cost of the following two different objects in a Task mining project:
- You can specify the cost of a task in the Cost definition dialog.
- You can specify the cost of an event by clicking
Automation Candidates table
Once the tasks have been identified and the logs cut, the application will create a list of tasks that can be automated. Each task instance will be represented by a separate timeline, which you can analyze using any of the available analysis modules.
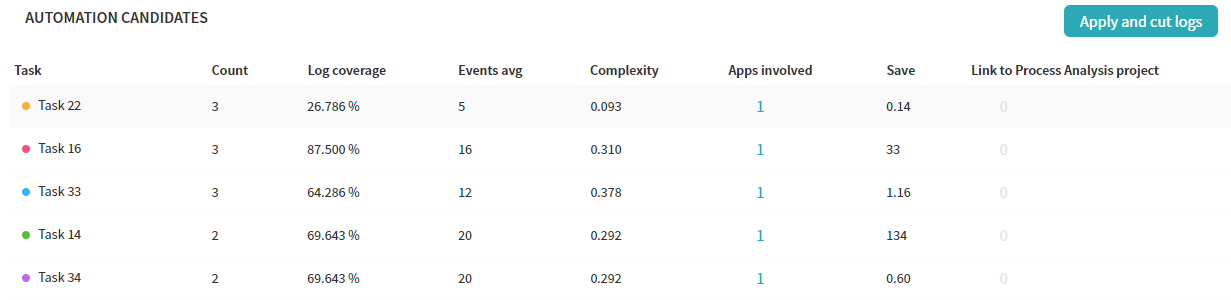
The Automation Candidates table contains the following columns:
- Task – The name given to the task when defining it.
- Count – The number of identified task instances in the logs.
- Log coverage – The percentage of the forms in the logs that are related to the task.
- Events avg – The average number of actions required to perform the task (for example, clicking a button or opening a tab).
- Complexity – The complexity of the task, determined based on the number of task variations, the number of forms, and the applications involved. The greater its value, the more complicated the task will be to perform.
- Apps involved – The number of applications used when performing the task. Click the number to see the names of the applications.
- Save – The money you can save by automating the task. You need to specify the cost of the tasks to see this value.
- Link to Process Analysis project – You can associate controls from your current Task Mining project with events from process analysis projects using Task View Schema. Click the number to see information about connected projects.
Candidates Distribution chart
The Candidates Distribution chart allows users to estimate and select tasks that would benefit most from automation. Each task is presented as a bubble on the chart. Hover over a bubble to see the task name, the number of task instances, and the gain and complexity of the task.
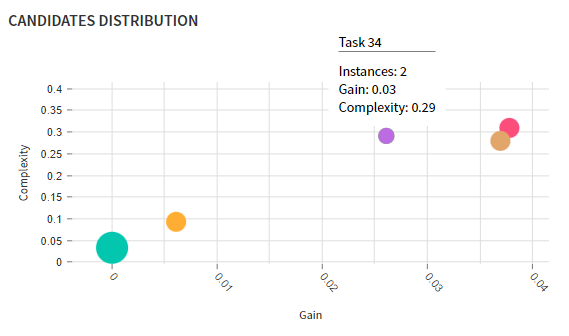
Interpreting the chart
- Gain axis – Gain is determined by the time required to complete a task. The greater the gain for a task, the more you will benefit from automating it.
- Complexity axis – Tasks may have multiple variations involving the use of different applications, and contain different numbers of forms. The combination of these factors determines the complexity of a task.
- Bubble size – The size of a bubble shows how often the task occurs in the log. The bigger the bubble, the more frequent the task.
Typically, it is recommended to automate frequent tasks that have high Gain and low Complexity values, as they will give greater time and cost savings.
