Docs
DocsProcess schema
Main use
The process schema editor gives you the capability to visually map the most common path of your business processes, while also displaying all of the ad-hoc process flows. You can let the tool take what it believes to be the most important milestones (events) through statistical analysis, or choose your own to see a process schema and visualize your entire business process. If you let the schema tool choose the important milestones, Process Intelligence uses advanced statistical analysis to specifically choose which steps are most reliably and commonly occurring at the same place in the process.
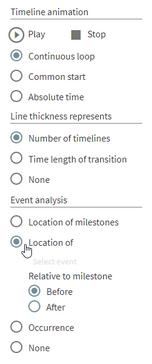
As processes age you can quickly identify process instances that are delayed and taking longer than others. As an instance ages the coloring changes from green, to yellow, orange, and then red. The thickness of the transition lines can represent either the number of timelines that possess that transition, or the time length of that specific transition. You can quickly discover areas where bottlenecks are present and drill in to specific process instances to investigate root cause.
To use this tool, select the Analyze > Process schema menu.
Overview
-
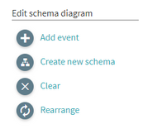
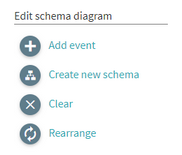
To get started, click Create new schema.
-
Click Select default milestones for the application to automatically select the most important events, or choose events yourself.
-
Click Generate schema.
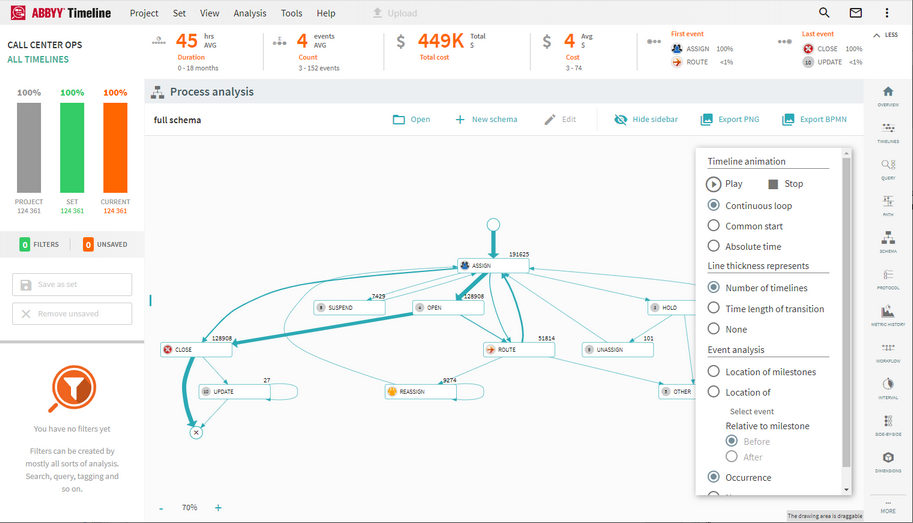
A schema similar to the example below displays.
The interface is completely adjustable and events can be moved around to form a completely customized schema.
-
Save the schema.

The tool can act as a monitoring platform. You can find where locations are likely to occur and display the percentage of likelihood on the transition line by selecting an event under the location of option in the Event analysis section of the schema control panel.
Process schemas can also be visualized in the Path Analysis module to compare schemas side-by-side while also allowing you to compare time and cost.
Example
The process schema below shows the most common schema based on the milestones of that particular process. It shows exactly what number of cases follow which paths and where time is being spent by the thickness of the bars; hovering your mouse over reveals statistics about the process flow. With this analysis tool you can begin to understand how the process is most commonly being executed. Process Intelligence is able to identify where processes must often flow and identify spots where an event is likely to occur by displaying the percentage of likelihood along the schema.