 Docs
DocsMetric history
Main use
The Metric History tool can be used to visualize any metric over time on how it changes during that period.
To use this tool, select the Analyze > Metric History menu.
Overview
You can select a specific date range to analyze by typing in the ranges, or by moving the range slider on the metric history graph.
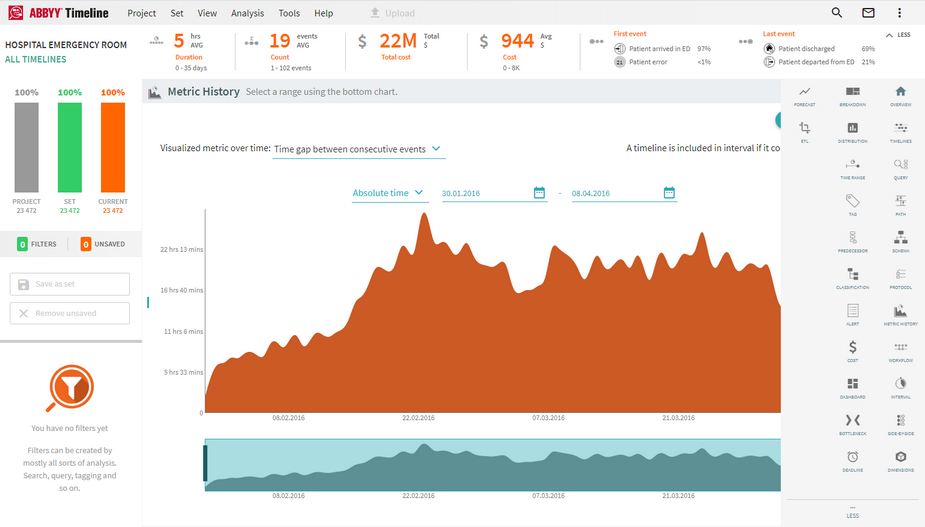
The Visualized metric over time dropdown list includes the following options:
- Count of timelines
- Events per timeline
- Unique events per timeline
- Event count
- Duration
- Business duration
- Time gap between consecutive events
- Custom time gap
- Cost of timelines
- Cost of events
As you further scope your analysis, you can set a filter to drill in on those specific timelines.
