Docs
DocsDimensions and breakdown
Main use
Dimensions and attributes are used to drill in and break down additional data attributes and dimensional data. These tools allow the user to drill in on specific dimensions and attributes. Often this is used to determine the root cause as users scope their analysis. The dimensional data can, for example, be representative of the employee, department, region, or IT system that is responsible for the activities.
Dimension
A dimension is an event’s attribute which is declared as dimension. The declaration could be automatic or manual by the user. The automatic declaration is based on the series of rules such as:
- The type of the data in the attribute is String or Number, and
- The count of unique values of this attribute is between 2 and 2000.
If both conditions are met, the attribute is considered a dimension. This happens during the post-load analysis.
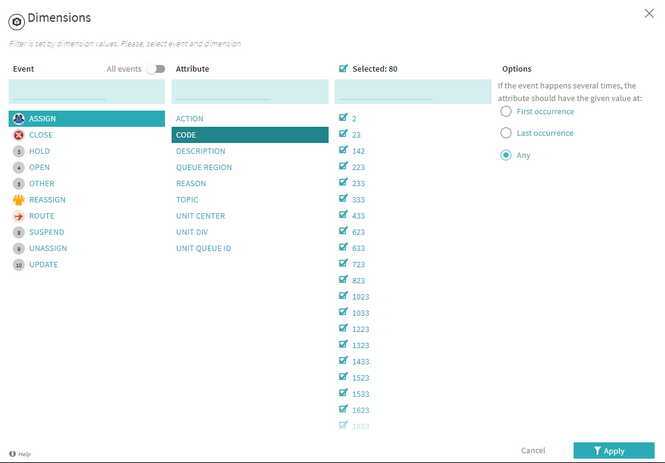
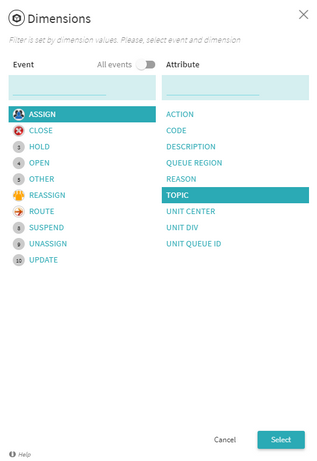
User could change the dimension property of the attribute in the Dimensions panel. To open this panel, click the Dimensions icon ( ) in the right application menu. Then select an event and the attributes.
Dimension values and their count
The set of unique values of a given dimension is called "dimension values". The number of timelines where this attribute has this value is called "value count".
Dimension filter
Users can filter timelines in the current set by the dimension value.
This article describes how and where the dimensions are used in Process Intelligence. It includes:
- Filtering by dimension value
- Timeline metrics breakdown by dimension
- Time interval between events – breakdown by dimensions
Data
The first column has all activities, ordered by the number, just like in Activity Selector. The second column shows all dimension attributes for the selected activities. The last column shows the unique dimension values for the selected attribute sorted alphabetically.
This panel acts as any other filter, reducing the number of the timelines in the current set.
If the same activity happens several time in a timeline, any of the should have the selected value in order to pass the filter.
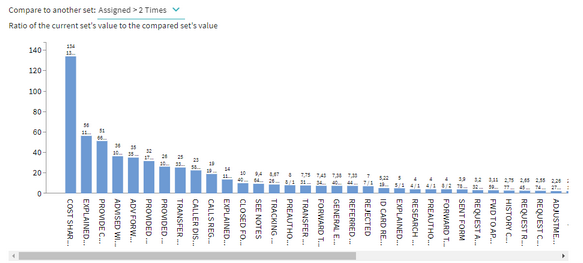
Breakdown of timeline metrics
When the user clicks on the metric box, the filter comes, it is does now. In addition to it, the user is displayed the Trellis chart which breaks the metric down by the selected dimension.
The chart displays the selected metric for X top dimensions – the dimensions with the highest count of the timelines in it. The count of the timelines can also be displayed next to each dimension value, in the title, like it’s shown for the first couple.
All small charts should have the same X and Y scales.
Setting the filter
Once the user clicks on a small chart, the main histogram displays the timelines for the selected dimension value. The histogram title "All timelines" changes to display the actual value of the selected dimension, like Atlanta, Baltimore, etc.
Removing the filter
If the user clicks on the histogram or on the same small chart again – the chart flies back and the histogram displays the unfiltered timelines.
Changing the filter
If the user clicks on a small chart for, for example, Atlanta, and then clicks on Baltimore, the Atlanta flies back and the Baltimore flies to the histogram and becomes selected.
Once the user clicks Apply filter, two filters are created: one for the duration (if user changed the sliders) and one for dimension (if user set the filter).
Choosing the dimension
When the panel displays, the breakdown dimension is not set. Instead, the text in its place says "Choose breakdown dimension". The area for Trellis charts is empty and text explains why: Once the user clicks on the link, the Dimension panel displays.
Example
Breakdown
The user will select the event and the corresponding attribute to further drill in on the various values.
The breakdown will then show all of the different attributes and the amount of timelines and percentages that were used in the data set. Filters can then be applied to specific Values.
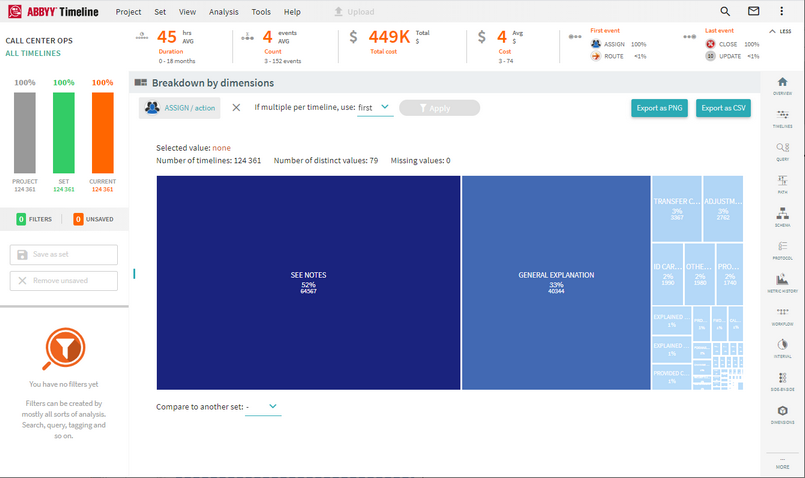
The user can also compare this to a different data set.