Reports – Dashboard
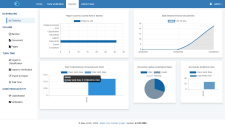
The Reports dashboard displays when you click Reports or Reports > Statistics.
Statistics
The Reports > Statistics page displays a charts dashboard with the following chart types and information:
- Pages count by current role in system – The number of pages that have been processed by the current user, including how they have been processed.
- Daily volume trend (in documents) – The volume of documents processed by the current user over the last 30 days.
- User productivity (in documents per hour) – The split when processing documents for the current user between class verification and data verification.
- Document capture automation rates – The split between valid, invalid, and data with warnings that has been automatically extracted during processing.
- Documents verified by user – The number of documents that have passed through data verification user using the class verification and data verification roles.
Each chart includes tooltips that provide detailed information on data value and source for any data point on mouse hover.
 Docs
Docs
