 Docs
DocsQueue Snapshot Comparison (Data Source)
BPDS_QueueSnapshotComparison
Returns queue snapshot data for today’s date using the timezone specified in the snapshot configuration, and compares the data with the same statistic from a previous day’s snapshot data.
Source: Blue Prism Database - Live tables and MI Repository (requires collect utilization and productivity statistics to be enabled under Settings - Reporting).
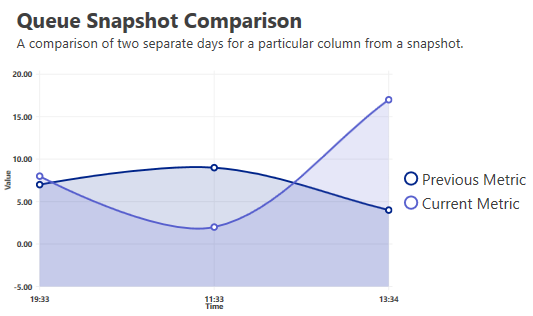
Sample Chart
Parameters
| Parameter Name | Data Type | Description | Validation |
|---|---|---|---|
| @QueueName | Text | Enter the name of the queue to be queried. | None |
| @NumberOfSnapshottedDaysPrevious | Integer |
Enter the number of days to count back from today in order to select the snapshot data to be used in the comparison. Only the days that are scheduled to have snapshot data taken are included in the count. For example, if today is Monday and snapshots are scheduled to occur every day, entering a value of 1 will compare the snapshots for today (Monday) and yesterday (Sunday). However, if snapshots are scheduled to only occur Monday to Friday, then entering a value of 1 will compare the snapshots for today (Monday) and the previous Friday. |
None |
| @ColumnIdentifier | Integer | Enter one of the following values to select which metric from the snapshot data to use when comparing the two sets of data:
|
1 to 15 |
| @TimeRangeStartTime | Text |
Enter the time from which to display queue data. If not specified then all time intervals will be displayed using the configuration applied to the queue. |
HH:mm (e.g. '01:15', '13:50', '22:10') |
| @TimeRangeEndTime | Text |
Enter the time up to which to display queue data. If not specified then all time intervals will be displayed using the configuration applied to the queue. |
HH:mm (e.g. '01:15', '13:50', '22:10') |
